DDR speeds are increasing with each iteration, making margins smaller for design success. Design functionality may be compromised if the quality of DDR bus signals is affected by noise. To verify the signal integrity for DDR designs, analyze crosstalk and reflection with Signal Integrity Metric Checking in Sigrity.
This how-to will provide step-by-step instructions on how to analyze single lines and coupled lines with an ideal PDN to ensure signal integrity of DDR Interfaces.
To follow along, use the provided design files above the table of contents.
How-To Video
Opening Sigrity for DDR Analysis
Step 1: Open Sigrity Layout Workbench or any Sigrity software package and select File > Switch Workflow from the menu.
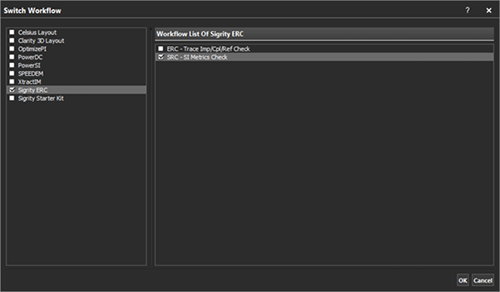
Step 2: From the tool selection list, select a software package that includes Signal Integrity Metric Checking such as Sigrity ERC or Sigrity Starter Kit. In the Workflow list, select SRC – SI Metrics Check and click OK.
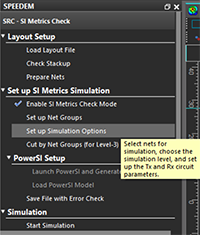
Preparing a Design for Simulation
Step 3: Under Layout Setup in the workflow pane, select Load Layout File.
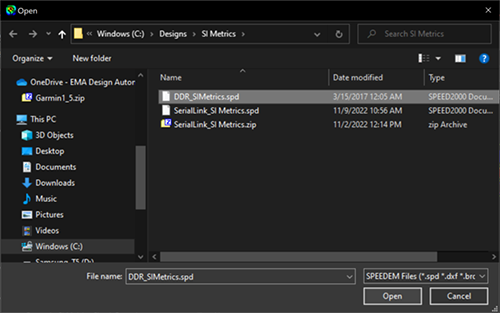
Step 4: Browse to the location of the provided files and select DDR_SIMetrics.spd. Click Open.
Note: By default, the Enable SI Metrics Check Mode is selected.
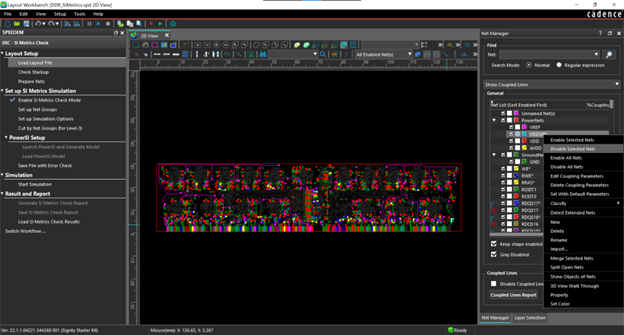
Step 5: Select the Net Manager tab. Right-click in the Net Manager panel and select Disable All Nets.
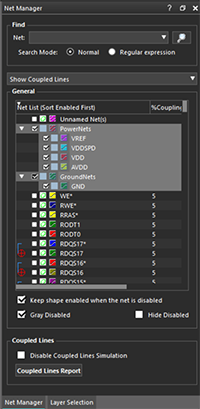
Step 6: In the Net Manager panel, check to enable the PowerNets and GroundNets.
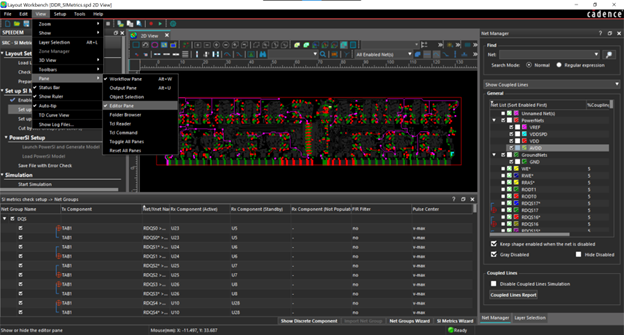
Step 7: From the menu, select View > Pane > Editor Pane to view the pre-configured net groups.
Note: If this pane is empty, select Set up Net Groups in the workflow.
Configuring Reflection Analysis
Step 8: In the workflow, select Set up Simulation Options.
Step 9: Under Net/RX/Pulse Options, ensure all nets are selected.
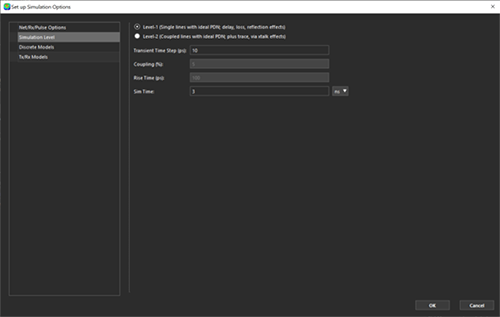
Step 10: Under Simulation Level, select Level-1 (Single lines with ideal PDN; delay, loss, reflection effects).
Step 11: Configure the following Simulation Level options:
- Transient Time Step (ps): 10
- Sim Time: 3 ns
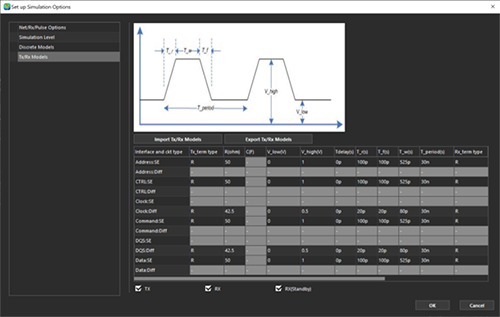
Step 12: Under Tx/Rx Models, review the pre-configured settings.
Note: The following information can be configured:
- Tx_Term and Rx_Term: Select the termination type for the transmitter and receiver. Select from either, R, Parallel RC, or Series RC. By default, R is selected.
- V_low: Low Input Voltage
- V_high: High Input Voltage
- T_delay: Delay Time
- T_r: Rise Time
- T_f: Fall Time
- T_w: Pulse Width
- T_period: Period Time
Step 13: Select OK.
Note: The nets which will be used in the simulation are enabled in the Net Manager.
Running a Reflection Simulation
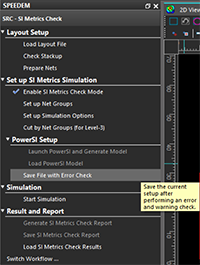
Step 14: In the workflow, select Save File with Error Check.
Step 15: Select Start Simulation.
Note: During simulation, the status is reported as busy and the progress of the simulation is shown. When the simulation is completed, the Results and Report options are automatically enabled.
Viewing Reflection Results and Reports
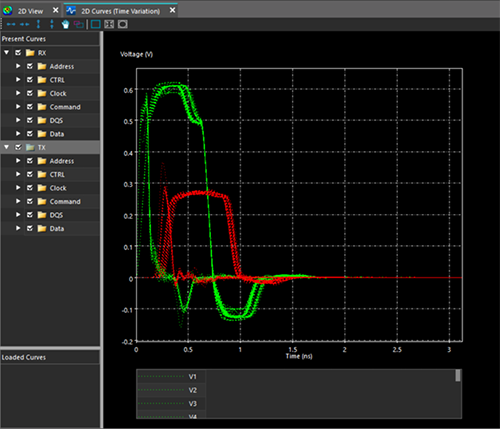
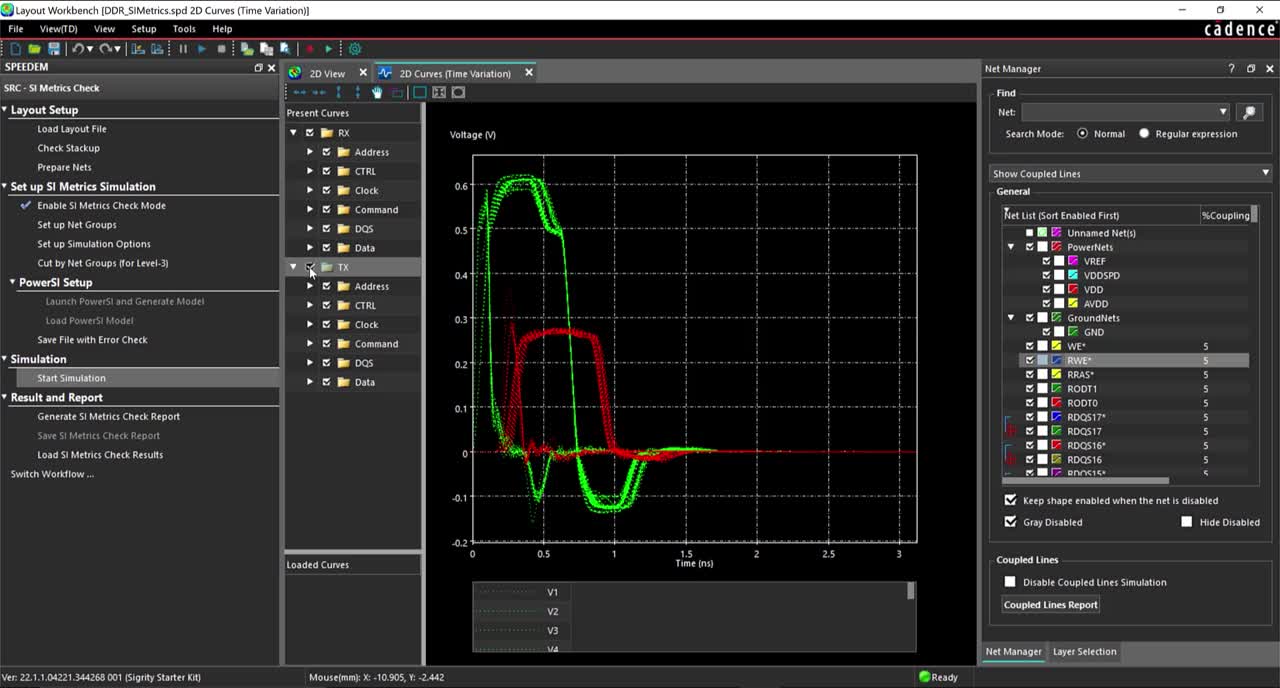
Step 16: When the simulation is complete, select RX and TX to view the graphical results.
Note: The green results show the transmitter (TX) waveforms at the transmitter component pins assuming all other nets are quiet. The red results show the receiver (RX) waveforms at the receiver component pins assuming all other nets are quiet.
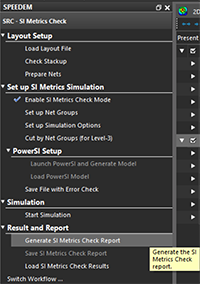
Step 17: In the workflow pane, select Generate SI Metrics Check Report.
Step 18: In the Options window, leave the defaults and click OK.
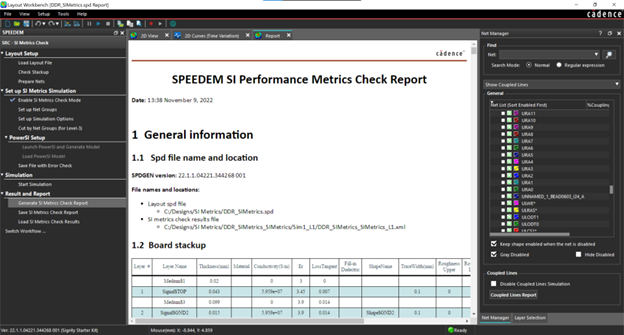
Step 19: View the generated SI Performance Metrics Check Report.
Note: The SI Performance Metrics Check Report includes general information, Layout SI metrics check net groups, time-domain simulation options and resources, and SI Metrics Check Results.
Step 20: Close the SI Performance Metrics Check Report.
Configuring Crosstalk Analysis
Step 21: In the workflow, select Set up Simulations Options.
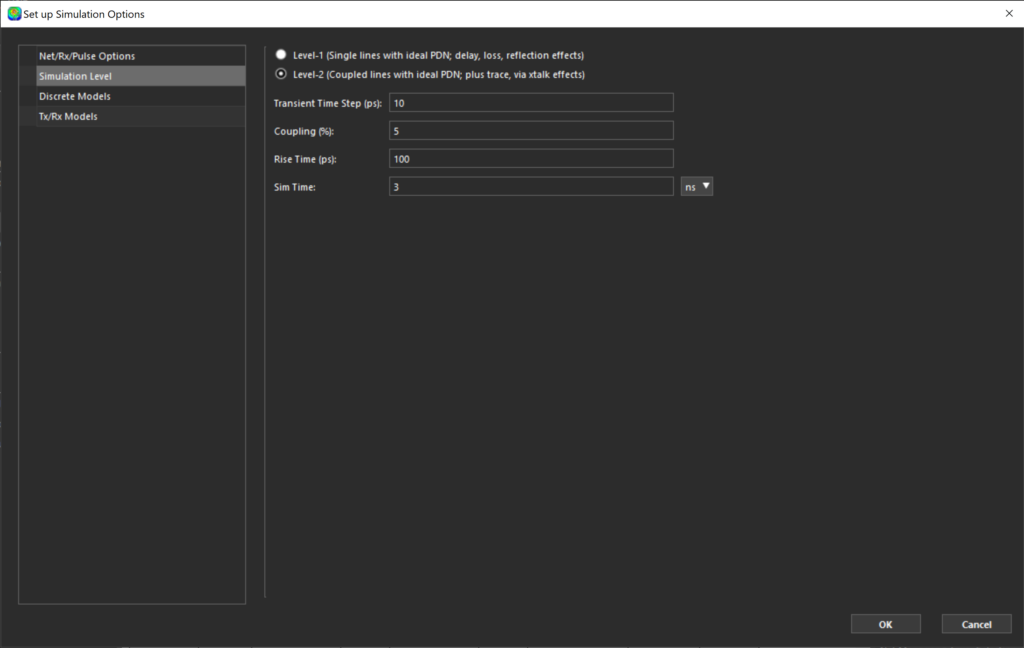
Step 22: Under Simulation Level, select Level-2 (Coupled lines with ideal PDN; plus trace, via xtalk effects).
Step 23: Configure the following Simulation Level options:
- Transient Time Step (ps): 10
- Coupling (%): 5
- Rise Time (ps): 100
- Sim Time: 3 ns
Step 24: Click OK.
Running a Crosstalk Simulation
Step 25: In the workflow, select Save File with Error Check.
Step 26: Select Start Simulation.
Viewing Crosstalk Results and Reports
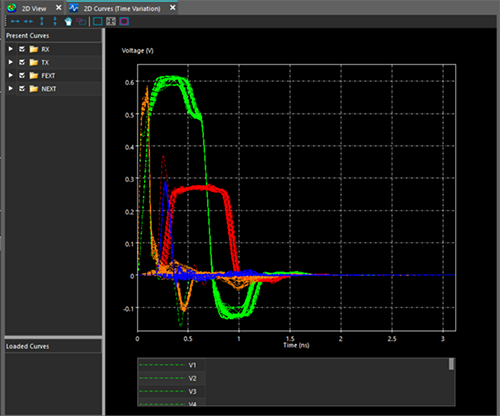
Step 27: When the simulation is complete, select RX, TX, FEXT, and NEXT to view the graphical results.
Note: The following results are reported:
- The green results show the transmitter (TX) waveforms at the transmitter component pins assuming all other nets are quiet.
- The red results show the receiver (RX) waveforms at the receiver component pins assuming all other nets are quiet.
- The orange results show the NEXT waveforms at the transmitter component pins assuming all other nets are in phase and active.
- The blue results show the FEXT waveforms at the receiver component pins assuming all other nets are in phase and active.
Step 28: In the workflow, select Generate SI Metrics Check Report.
Step 29: In the Options window, leave the defaults and click OK.
Step 30: View the generated SI Performance Metrics Check Report.
Note: The SI Performance Metrics Check Report includes general information, Layout SI metrics check net groups, time-domain simulation options and resources, and SI Metrics Check Results.
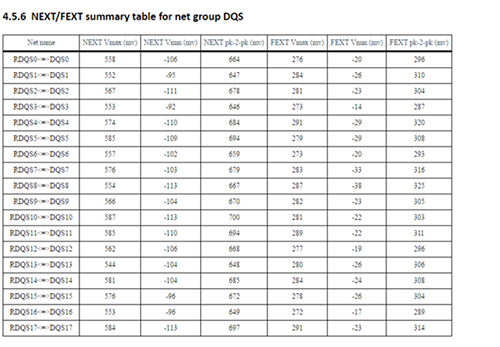
Step 31: Scroll down to section 4.1.6 NEXT/FEXT Summary table for net group DQS. Review the crosstalk results for each net group.
Wrap Up & Next Steps
Analyze crosstalk and reflection for critical nets of your DDR interfaces to improve signal integrity. See how Sigrity can help tackle your signal and power integrity challenges. For additional tutorials and training, such as performing IR drop analysis, return path analysis, and electrical rule checking, enroll in our free Sigrity workshops.
