Devices such as switched-mode power supplies and RF amplifiers require a full analysis of open-loop gain across their entire operating spectrum to ensure proper behavior; however, calculating gain and phase shift at each individual frequency is tedious and time-consuming. With the Frequency Response Analysis included in PSpice Designer, open-loop gain analysis becomes simple with automated analysis and Bode plot creation.
This how-to will provide step-by-step instructions for configuring, performing, and evaluating frequency response analysis in OrCAD PSpice Designer.
To follow along with this tutorial, download the provided files above the table of contents.
How-To Video

Creating a Schematic
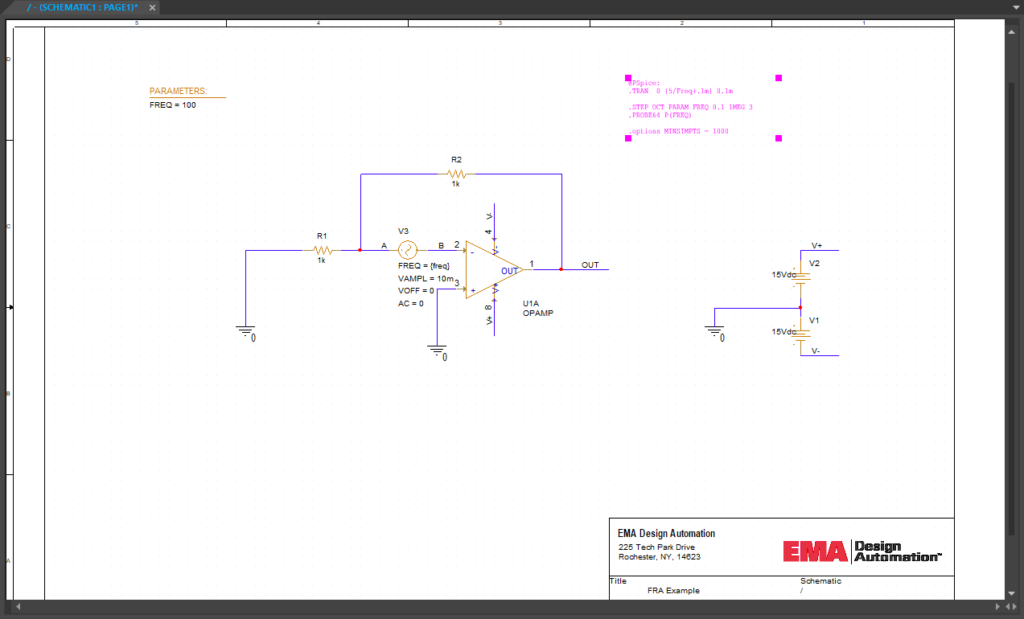
Step 1: Open the provided design, FRAExample.obj, in OrCAD PSpice Designer.
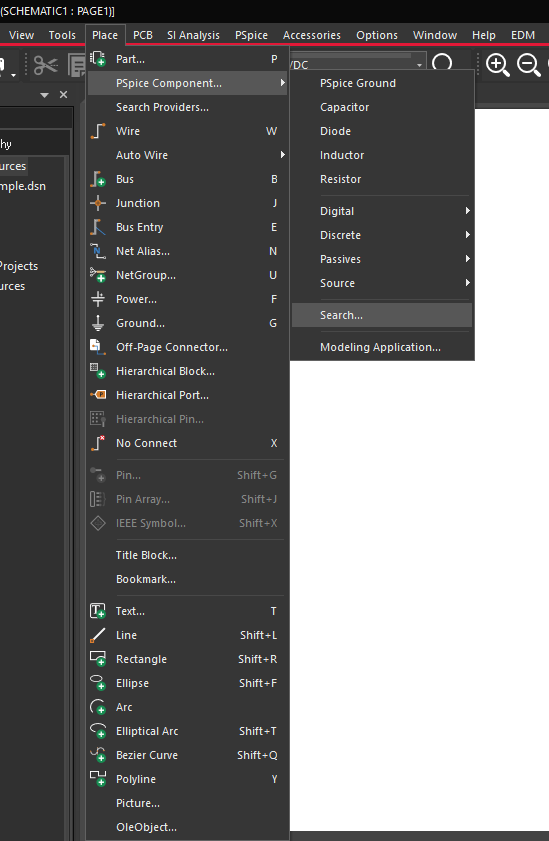
Step 2: Select Place > PSpice Component > Search from the menu.
Configuring a Voltage Source
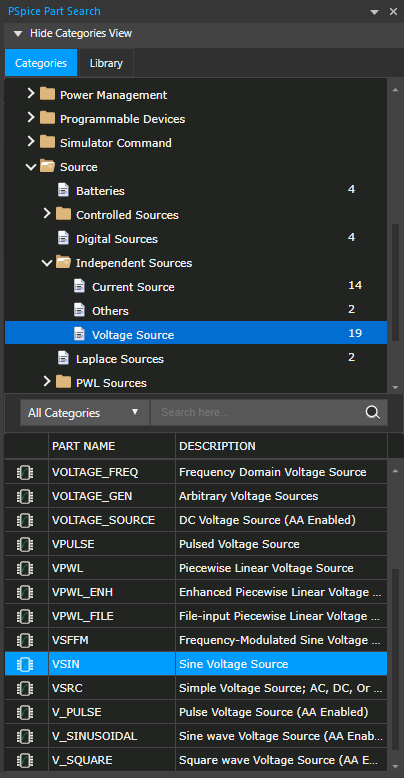
Step 3: Under the Categories tab, open PSpice > Source > Independent Sources > Voltage Source.
Step 4: Select VSIN from the part list. Double-click to attach the part to the cursor.
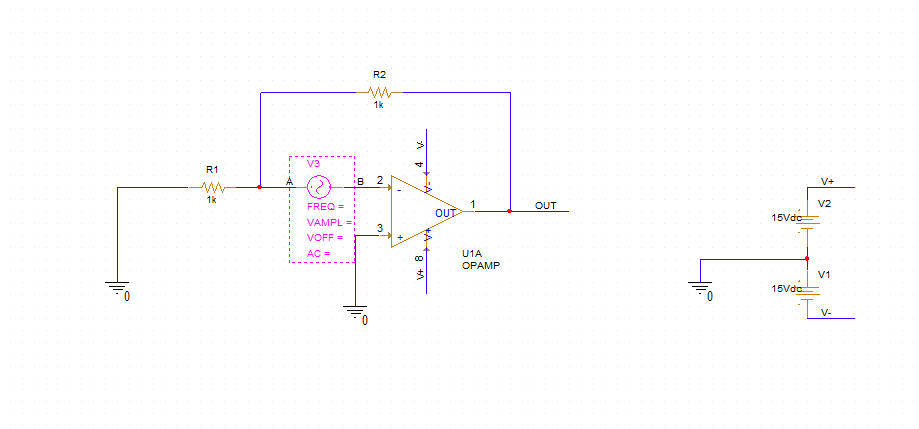
Step 5: Place the AC source between nodes A and B. Use R on the keyboard to rotate as needed.
Step 6: Right-click and select End Mode or press Escape on the keyboard.
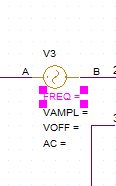
Step 7: In the AC Source, double-click the FREQ = parameter to change the frequency.
Step 8: Enter {freq} for the value to set the frequency from a parameter. Click OK.
Step 9: Double-click the VAMPL= parameter to change the amplitude. Set the amplitude to 10m and click OK.
Step 10: Double-click the VOFF= parameter to change the offset. Set the offset to 0 and click OK.
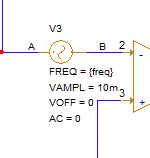
Step 11: Double-click the AC= parameter. Set the value to 0 and click OK.
Adding Parameters to the Simulation
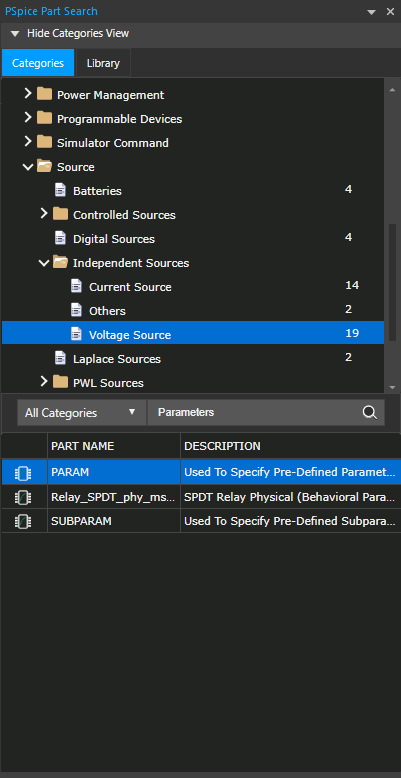
Step 12: In the PSpice Part Search tab, enter Parameters into the search bar and press Enter.
Step 13: Select the part with name PARAM. Double-click to attach to the cursor.
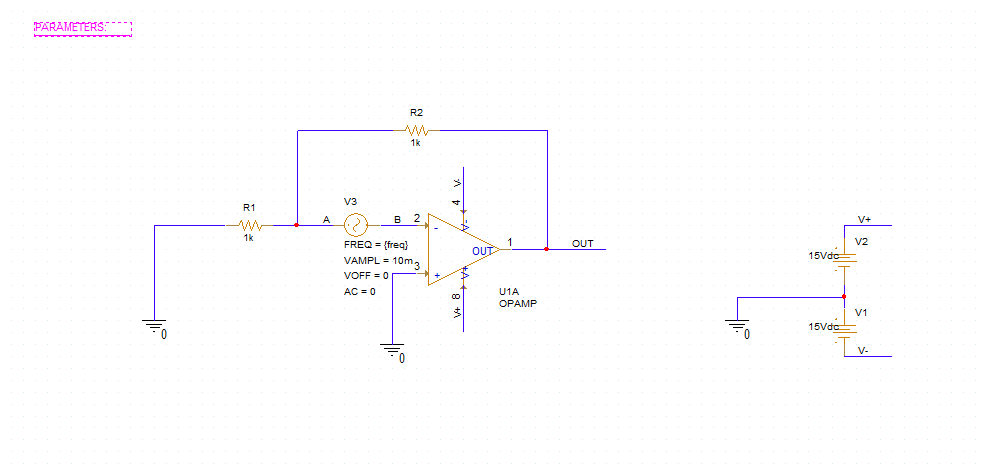
Step 14: Click to place the parameter table. Right-click and select End Mode (Escape).
Step 15: Double-click the parameter table. This will open the Property Editor tab.
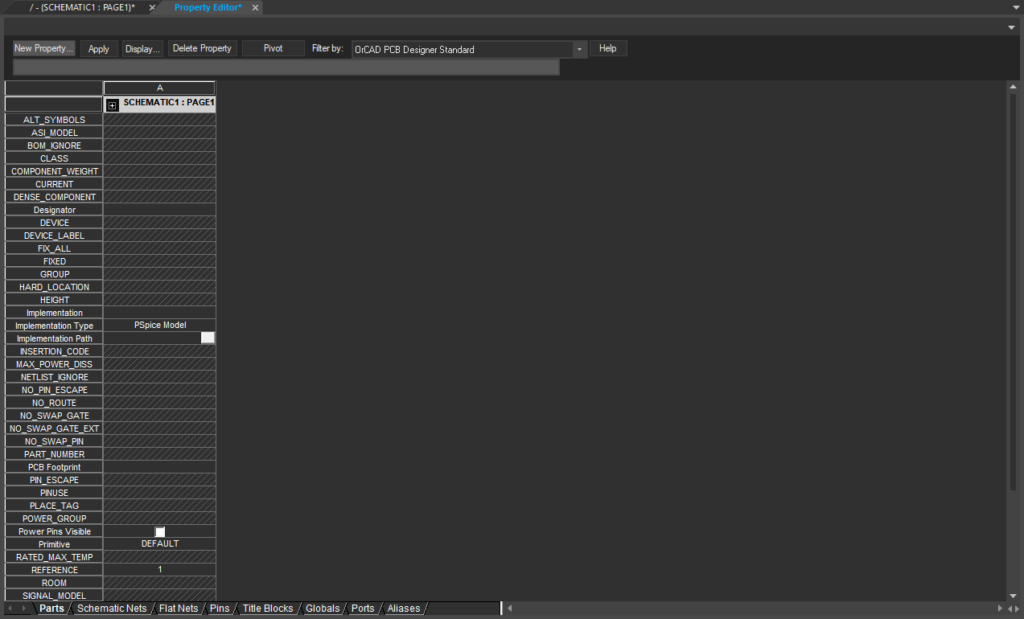
Step 16: Select New Property. This will open the Add New Property window.
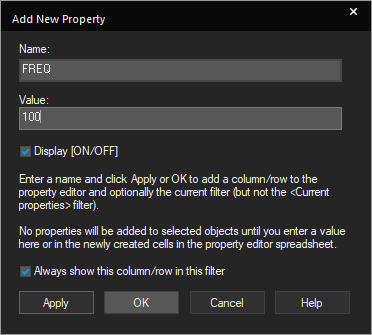
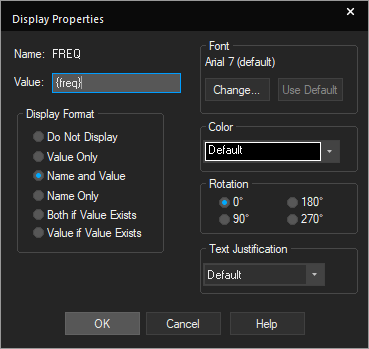
Step 17: Add FREQ as the name and 100 as the value. Check Display [ON/OFF] and click OK.
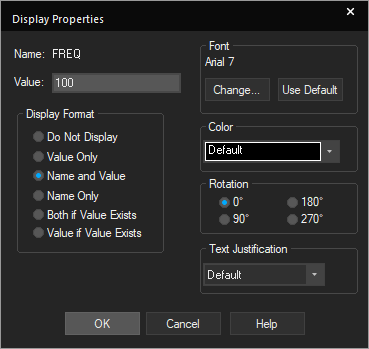
Step 18: The Display Properties window will open. Select Name and Value under Display Format and click OK.
Step 19: Select Apply and close the Property Editor tab.
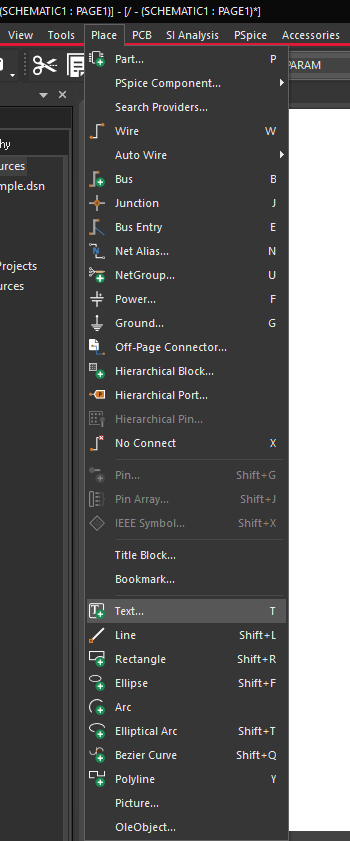
Step 20: Select Place > Text from the menu.
Step 21: Enter the following text into the window:
@PSpice:

.TRAN 0 {5/Freq+.1m} 0.1m

.STEP OCT PARAM FREQ 0.1 1MEG 3

.PROBE64 P(FREQ)

.options MINSIMPTS = 1000
Note: Use CTRL-Enter to start a new line. If you accidentally press Enter, press CTRL-E on the keyboard to return to the text editor. This text is also included with the design file under OpenLoop.txt.
The .TRAN command performs a transient analysis on the circuit and uses the following syntax: .TRAN start time {end time} maximum step size. For this example, the analysis starts at time t=0 and ends at 5/Freq seconds + .1 millisecond with a maximum step size of 0.1 millisecond.
The .STEP command performs a sweep on the circuit with the following syntax: .STEP sweep variable starting variable ending variable. For this example, OCT indicates that the sweep variable, parameter FREQ, is swept by logarithmic octave beginning at 0.1Hz and finishing at 1MHz.
The .PROBE64 command allows the FREQ parameter to be stored in the 64-bit Probe output results to calculate the Frequency Response Analysis later.
.options MINSIMPTS specifies the minimum number of time points used for each transient simulation. For this example, 1000 time points have been specified.
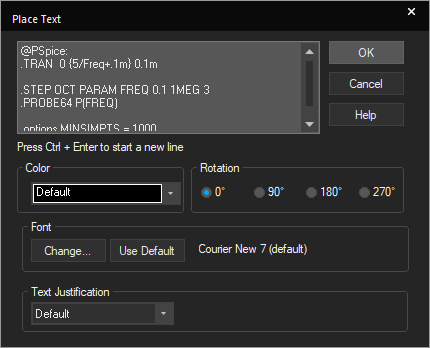
Step 22: Click OK to attach the text to the cursor.
Step 23: Place the text in a blank area in the schematic. Right-click and select End Mode (Escape).
Preparing the Design for Simulation
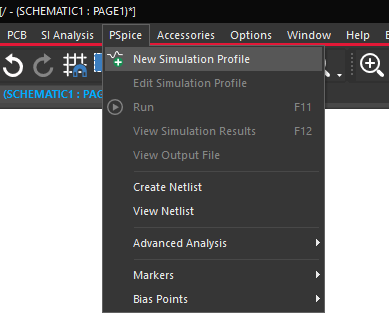
Step 24: Select PSpice > New Simulation Profile from the menu.
Step 25: Name the simulation BIAS and click Create.
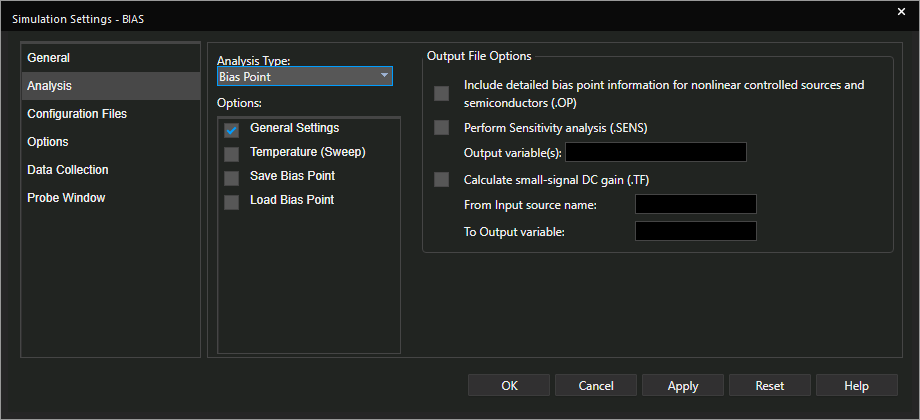
Step 26: Set the Analysis Type to Bias Point.
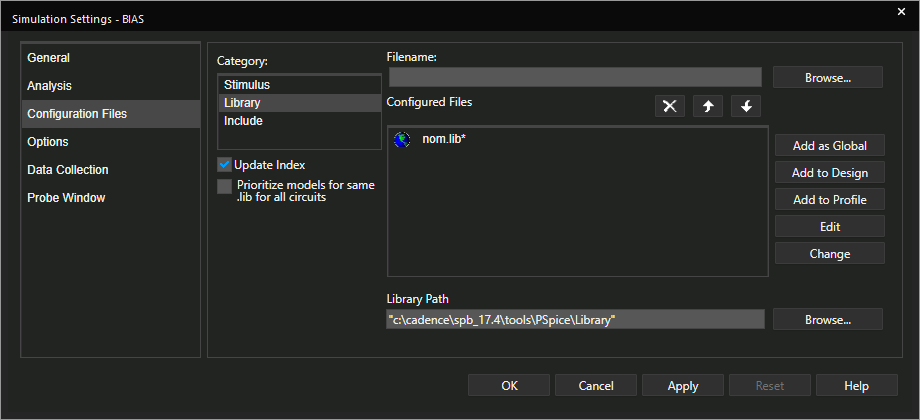
Step 27: From the menu, select Configuration Files. Select Library under Category.
Step 28: Select Browse.
Step 29: Navigate to the location of the downloaded files. Select opamp.lib and click Open.
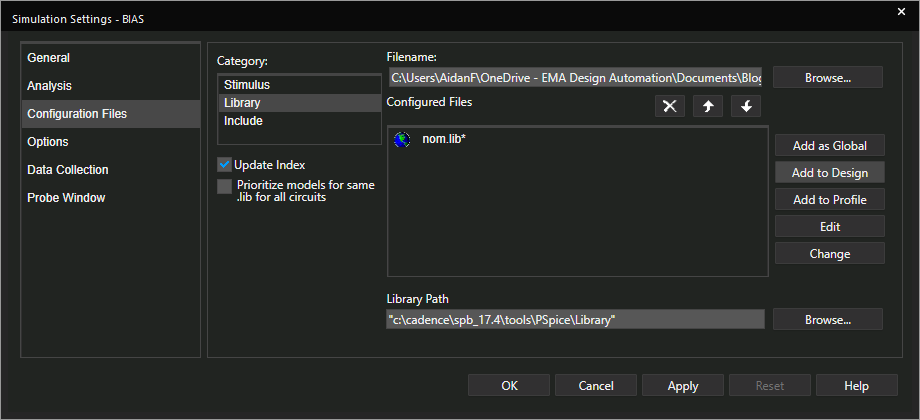
Step 30: Select Add to Design. Click OK.
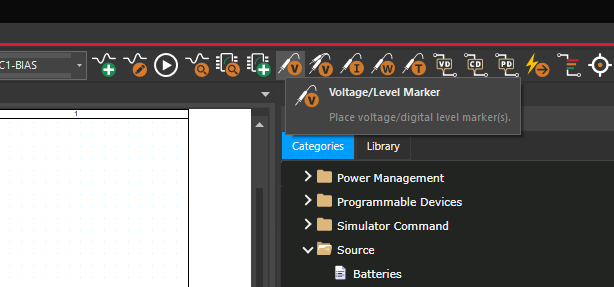
Step 31: Select the Voltage/Level Marker button from the toolbar.
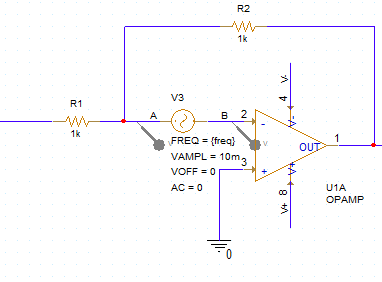
Step 32: Place one probe at net A and another probe at net B. Right-click and select End Mode (Escape).
Performing Frequency Response Analysis
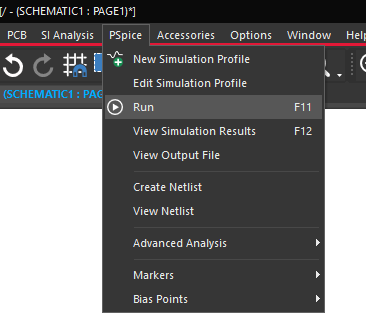
Step 33: Select PSpice > Run from the menu or the Run button from the toolbar.
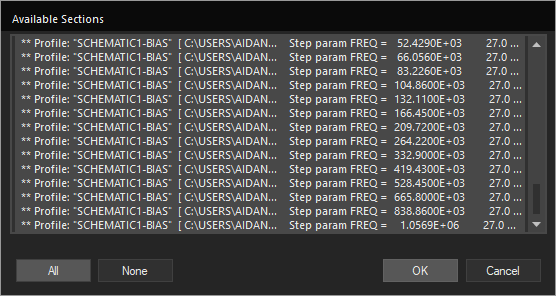
Step 34: In the Available Sections window, select All and click OK.
Note: The simulation end points are different for each trace. This is accomplished with the text on the schematic canvas and done to save simulation time.
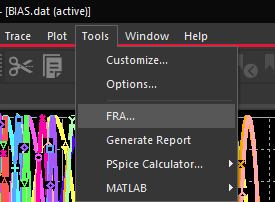
Step 35: In the simulation window, select Tools > FRA from the menu.
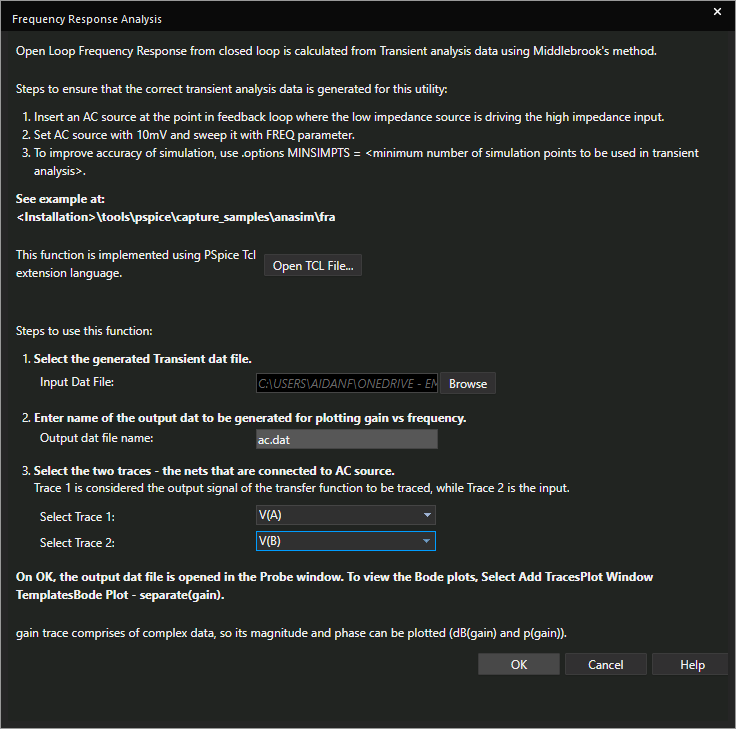
Step 36: In the Frequency Response Analysis window, select V(A) under Select Trace 1 and V(B) under Select Trace 2. Click OK.
Note: Frequency response analysis injects transient signals into the desired circuit then extracts frequency data using Fourier analysis to plot gain/phase response.
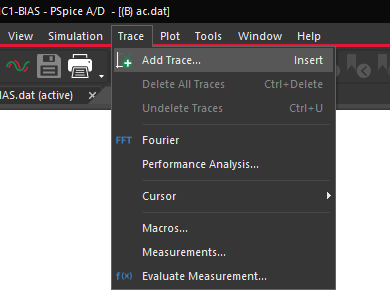
Step 37: Select Trace > Add Trace from the menu.
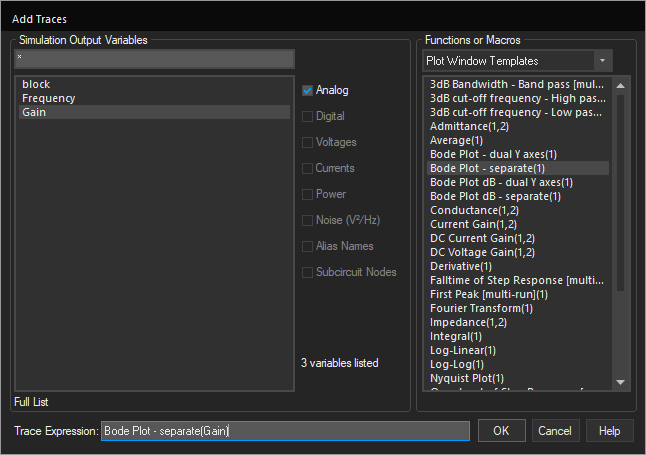
Step 38: From the Functions or Macros dropdown, select Plot Window Templates. Select Bode Plot – separate(1).
Step 39: Select Gain from the Simulation Output Variables list. Click OK.
Step 40: To view the magnitude, select Plot > Add Plot to Window from the menu.
Step 41: Select Trace > Add Trace from the menu.
Step 42: Under Functions or Macros, select Analog Operators and Functions.
Step 43: Select DB().
Step 44: From the Simulation Output Variables, select Gain. Click OK.
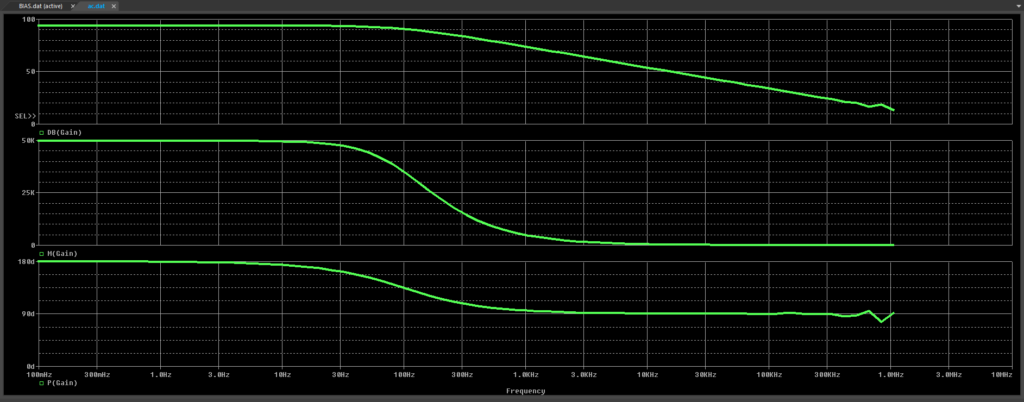
Step 45: View the results.
Wrap Up & Next Steps
Manually calculating gain and phase shift at every point in the frequency spectrum to create a Bode plot is monotonous and labor-intensive. With Frequency Response Analysis in OrCAD PSpice Designer, calculations along the entire frequency spectrum are automatically collected saving time and guaranteeing accurate results. Learn more about how PSpice can verify circuit functionality and get your free trial today.

