Many modern electronic designs involve communication between multiple boards or devices. For an accurate analysis of circuit behavior, it may be necessary to model custom inputs, such as those seen from an oscilloscope. With PSpice, you can create a stimulus from oscilloscope data and quickly integrate an accurate source for SPICE simulations.
This quick how-to will provide step-by-step instructions on how to create a stimulus from oscilloscope data with a piecewise linear source in PSpice.
To follow along, download the provided files above the table of contents.
How-To Video
 Open in New Window
Place the Stimulus Source
Note: To create a stimulus from oscilloscope data in your own simulations, first obtain a CSV file of the desired oscilloscope data. Oscilloscope binary data is typically saved in a proprietary format. This data needs to be converted to a format such as CSV to be used as a stimulus in PSpice. Your oscilloscope manufacturer will typically offer software to convert data to the universal CSV format.
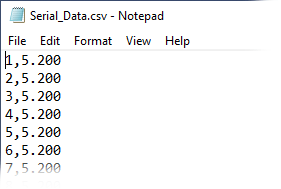
The file cannot contain any headers. Remove headers before proceeding.
Data must be in the format time,value or time value.
Step 1: Open the provided design in PSpice Designer.
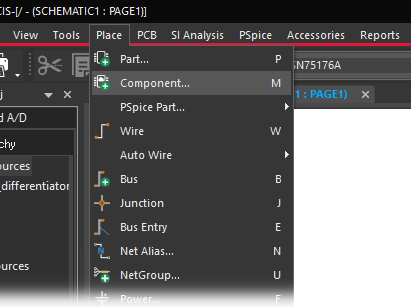
Step 2: Select Place > Component from the menu.
Step 3: The Component Explorer tab opens. Expand PSpice under Categories and select Source > PWL Sources > Voltage Source.
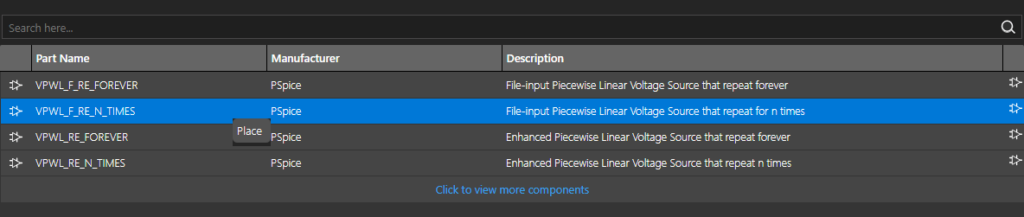
Step 4: Select VPWL_F_RE_N_TIMES from the parts list. Right-click and select Place.
Note: This PWL source will repeat the stimulus a finite number of times. The following sources can also be placed from this list.
- VPWL_F_RE_FOREVER: File-input source that repeats forever.
- VPWL_F_RE_N_TIMES: File-input source that repeats a fixed number of times.
- VPWL_RE_FOREVER: Enhanced source that repeats forever. PWL data is defined in the Properties tab.
- VPWL_RE_N_TIMES: Enhanced source that repeats a fixed number of times.
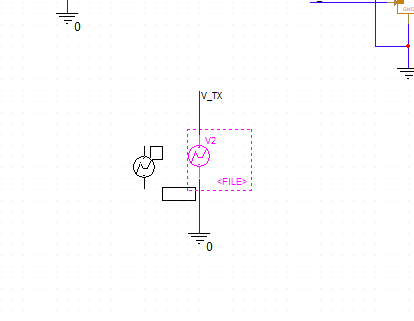
Step 5: Click to place the source in the schematic. Right-click and select End Mode.
Create a Stimulus from Oscilloscope Data
Step 6: Double-click the <FILE> value on the source to change the input file link.
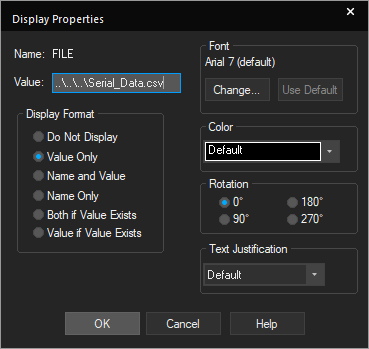
Step 7: The Display Properties window opens with space to edit the value. Enter ..\..\..\Serial_Data.csv and click OK.
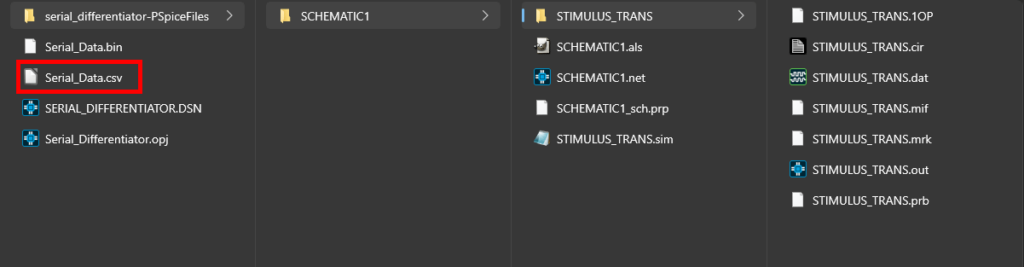
Note: PSpice reads all file paths from the simulation folder. The ..\ string is interpreted as “up one level.” To read a file in the working directory, the file path must point up three levels.
It is not recommended to include spaces in the name of this file.
Step 8: Before creating and running the simulation, the number of repeats and scale factors must be set. Double-click the source to open the Property Editor tab.
Step 9: Locate the cell for REPEAT_VALUE in the Property Editor tab. Enter 2 to repeat the stimulus twice.
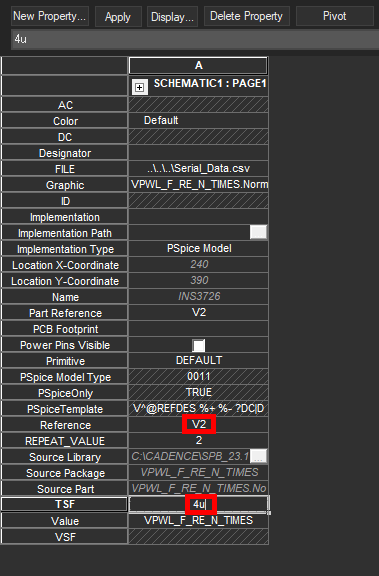
Step 10: In the TSF (Time Scale Factor) cell, enter 4u.
Note: This will scale all time factor values by 4u seconds.
The VSF (Value Scale Factor) cell is also available to scale the output of the stimulus. If no value is specified, the scale factor defaults to 1.
Step 11: Click Apply and close the Property Editor tab.
Create and Run the Simulation
Step 12: Select PSpice > New Simulation Profile from the menu.
Step 13: Enter STIMULUS_TRANS for the name and click Create.
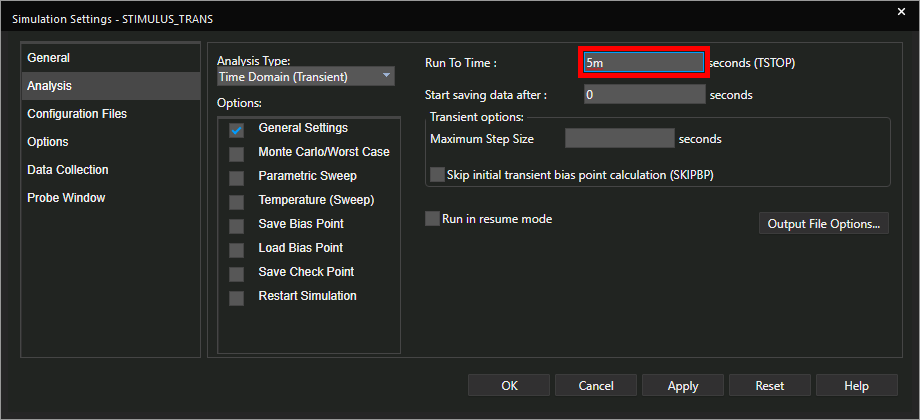
Step 14: The Simulation Settings window opens. In the Run To Time field, enter 5m for a runtime of 5m seconds.
Step 15: Leave the other settings as the defaults and click OK.
Step 16: Select the Voltage/Level Marker button from the toolbar.
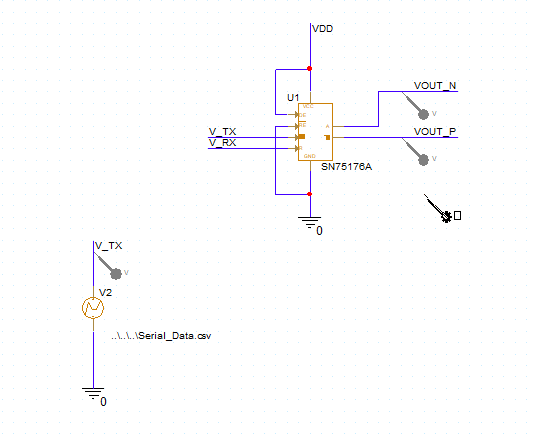
Step 17: Click to place probes at the V_TX, VOUT_N, and VOUT_P nets. Right-click and select End Mode when finished.
Step 18: Select PSpice > Run from the menu.
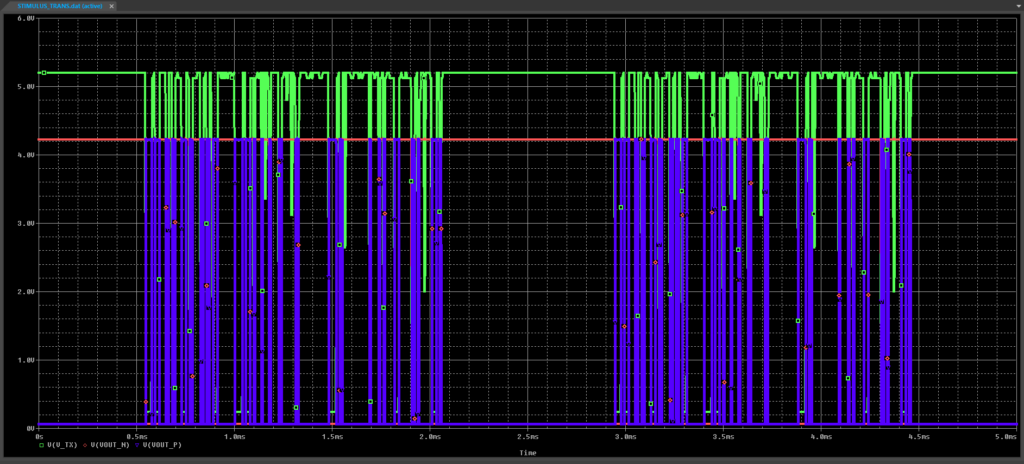
Step 19: View the results. The oscilloscope data is shown as the input trace. A differential signal is generated by the SN75176.
Note: For better visibility, create a new plot in the simulation window and move the input trace to it. To learn more about creating and modifying simulation plots, view our how-to here.
Wrap Up & Next Steps
Quickly and easily create a stimulus from oscilloscope data to create a realistic source and SPICE simulation with PSpice. Test out this feature and more with a free trial of OrCAD.

