For proper circuit functionality, critical components in the design may require tighter tolerances; however, with tighter tolerances comes increased component costs. With PSpice Designer Plus, you can analyze component tolerance and the effect on circuit behavior with sensitivity analysis. This advanced SPICE analysis allows designers to easily pinpoint critical components and ultimately find a balance between functionality and cost.
This quick how-to will provide step-by-step instructions on how to analyze the effects of component tolerance with Sensitivity Analysis in PSpice Designer Plus.
To follow along, download the provided files above the table of contents.
How-To Video
[coming soon]
Loading a Demo Design
Step 1: Open PSpice Designer.
Step 2: Select File > Open > Demo Designs from the menu.
Step 3: The Open Demo Designs window opens. Scroll down and select RF Amplifier.
Step 4: Click Open to open the design.
Note: If this design has been modified on your system, download the clean version provided above the table of contents.
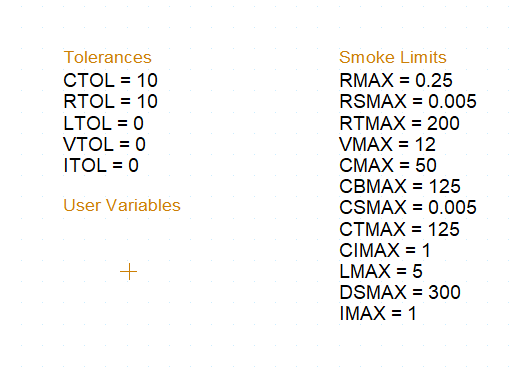
Step 5: View the Tolerances and Smoke Limits in the schematic canvas. Ensure that the values listed match those shown in the picture above.
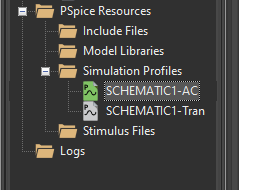
Step 6: In the Project Manager, under Simulation Profiles, verify that SCHEMATIC1-AC is highlighted in green, indicating it is the active profile.
Running a Simulation
Step 7: A simulation must be run and measurements must be defined before sensitivity analysis can be performed. Select PSpice > Run from the menu to start the AC sweep simulation.
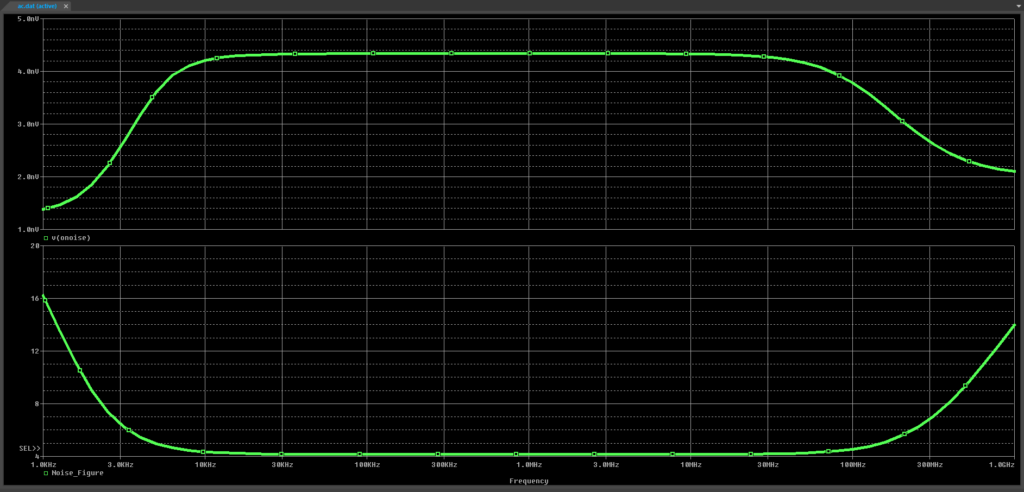
Step 8: View the AC sweep results. Two traces are shown in the PSpice A/D window.
Analyze Component Tolerance: Defining Measurements
Step 9: Measurements must be defined for sensitivity analysis. To define a measurement, select View > Measurement Results from the menu.
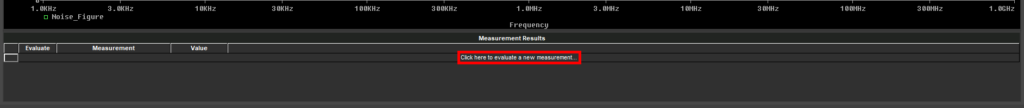
Step 10: The Measurement Results subpanel opens. Select Click Here to Evaluate a New Measurement to create a new measurement.
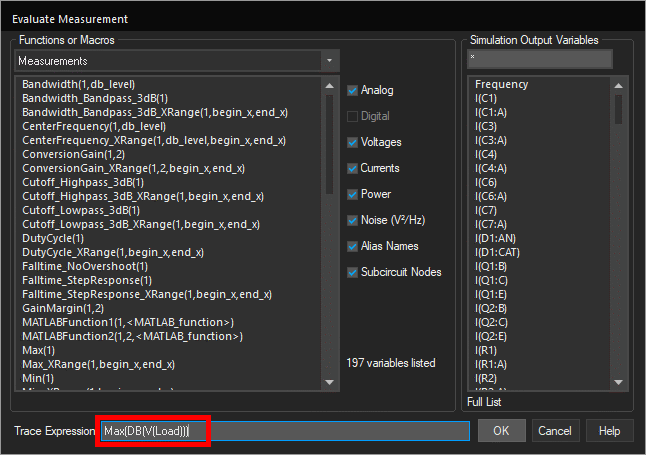
Step 11: The Evaluate Measurement window opens. Copy the expression Max(DB(V(Load))) and paste it into the Trace Expression box.
Step 12: Click OK to add the measurement. The measurement is added to the Measurement Results subpanel and the value is calculated.
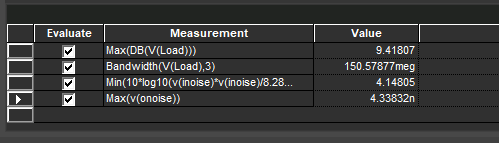
Step 13: Repeat steps 10-12 for the following expressions:
Bandwidth(V(Load),3)Min(10*log10(v(inoise)*v(inoise)/8.28e-19))Max(v(onoise))
Step 14: Close the PSpice A/D window.
Analyze Component Tolerance
Step 15: Back in the schematic window, select PSpice > Advanced Analysis > Sensitivity from the menu.
Note: If the PSpice Advanced Analysis Product Choices window opens, select the appropriate license and click OK.
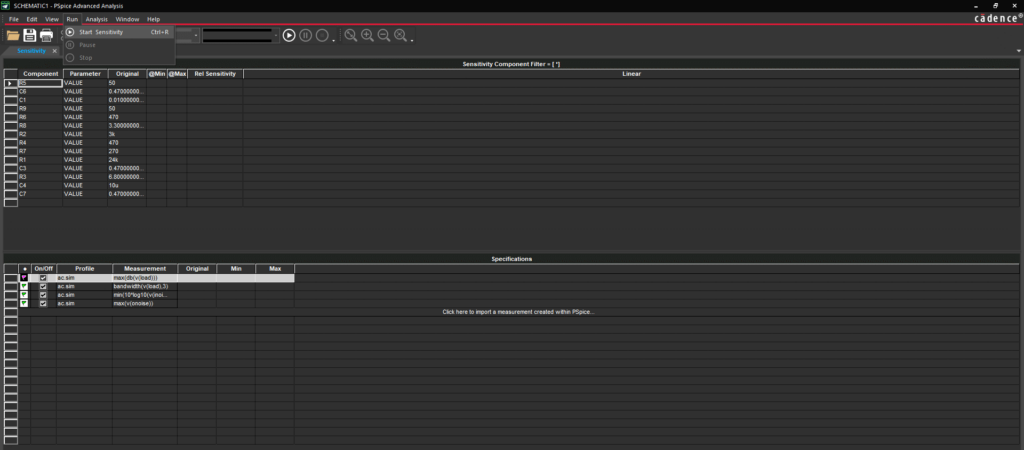
Step 16: The PSpice Advanced Analysis window opens. Select Run > Start Sensitivity from the menu to start the sensitivity analysis.
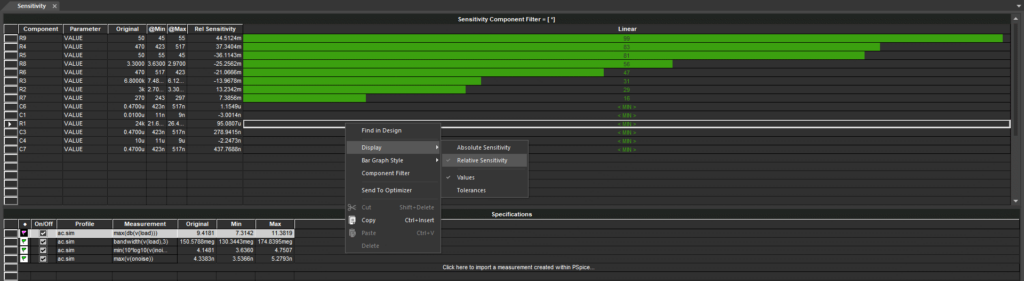
Step 17: The sensitivity for each component is plotted. Right-click in the table and select Display > Relative Sensitivity.
Note: Sensitivity analysis examines how much each component affects circuit behavior by itself and in comparison to other components. It also varies all tolerances to create worst-case minimum and maximum measurement values.
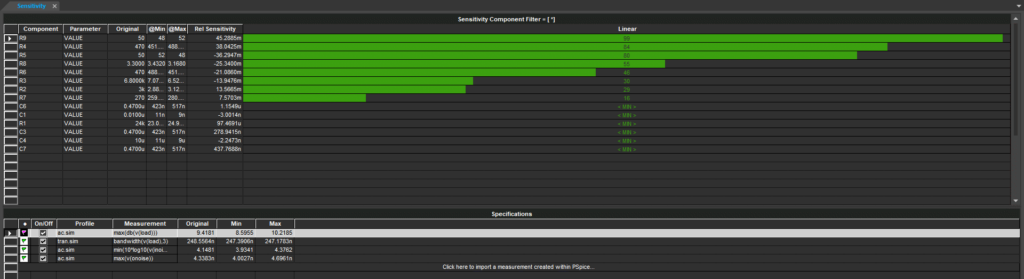
Step 18: The measurements shown in the Specifications table were loaded from the simulation. Click each measurement to view the sensitivity analysis results.
Note: The following values are plotted in the Sensitivity Component Filter table:
- Original: The originally defined component value.
- Min: The minimum component value within its specified tolerance.
- Max: The maximum component value within its specified tolerance.
- Sensitivity: The relative or absolute sensitivity weight.
Minima and maxima are also given for measurements, indicating their lowest and highest values with components at their minima and maxima.
Adjusting Tolerance
Step 19: Minimize the PSpice Advanced Analysis window and return to the schematic.
Step 20: In the Tolerance list, double-click RTOL to change the common resistor tolerance.
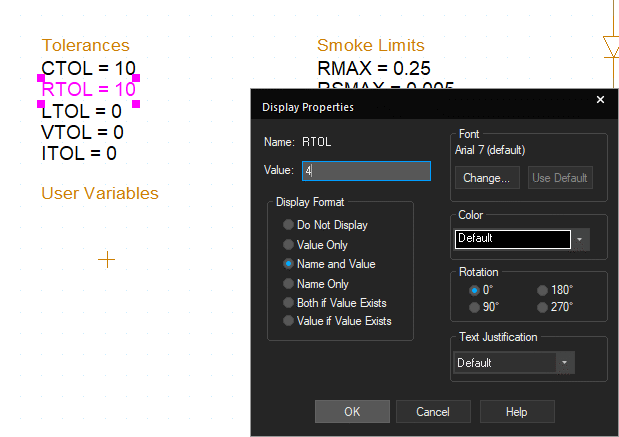
Step 21: The Display Properties window opens. Enter 4 for the value and click OK.
Step 22: Select PSpice > Run from the menu to re-run the simulation with the new resistor tolerance.
Step 23: The component values haven’t changed, so the normal simulation is the same. Close the PSpice A/D window.
Step 24: Back in the PSpice Advanced Analysis window, select Run > Start Sensitivity from the menu.
Step 25: View the results for each measurement. The minimum and maximum resistor values are now closer to the originals, and the measurement minima and maxima are also closer to the original values.
Wrap Up & Next Steps
Analyze component tolerance to determine which components contribute to circuit behavior the most, adjust component tolerance, and reduce costs with sensitivity analysis in PSpice Designer Plus. Test out this feature and more with a free trial of OrCAD. Want to learn more about Sensitivity Analysis and the other advanced analysis options in PSpice? View the Level 1 and Level 2 PSpice Advanced Analysis workshops.
