When designing an electronic control system, keeping the system stable is crucial to device operation. Control systems engineers use the stability margin to determine system stability, which measures the minimum distance from the Nyquist curve of the system to the critical point (-1, 0). In other words, the stability margin shows how much the phase and gain of a system can be increased before the system becomes unstable. To quickly perform a non-invasive stability measurement, PSpice 23.1 introduces a new algorithm to determine the stability margin of a system, known as the Non-Invasive Stability Margin (NISM), created by Picotest.
This quick how-to will provide step-by-step instructions on how to perform a non-invasive stability measurement with the Picotest NISM calculation in PSpice.
To follow along, download the provided files above the table of contents.
How-To Video
 Open in New Window
Optimizing the Design for NISM Analysis
Step 1: Open the provided design in PSpice Designer 23.1.
Note: The NISM feature was released in hotfix 7 and is available in PSpice 23.1.007 or above. If you are using an older version of PSpice, you can download the NISM measurement feature here or request an update for PSpice.
Step 2: To perform a non-invasive stability measurement, an AC analysis must be run which requires an AC voltage or current source to be added somewhere in the circuit. To place a source, select Place > PSpice Part > Source > Current Sources > AC.
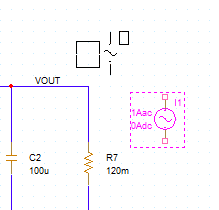
Step 3: An AC current source is attached to the cursor. Click to place the source near VOUT, then right-click and select End Mode.
Step 4: To connect the source, select Place > Wire from the menu.
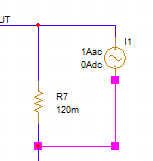
Step 5: Click to connect the signal to the VOUT and GND (0) nets. Press Escape on the keyboard when finished.
The circuit is ready to be simulated.
Configuring the Simulation
Step 6: An AC sweep simulation must be defined before it is run. To create a new simulation profile, select PSpice > New Simulation Profile from the menu.
Step 7: The New Simulation window opens. Enter NISM_AC for the name and click Create.
Note: If the Product Choices window opens, select the appropriate PSpice license and click OK.
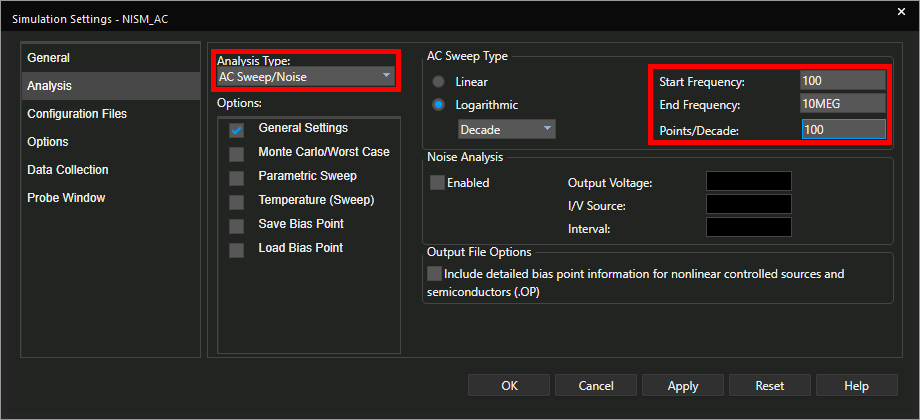
Step 8: The Simulation Settings window opens. Select AC Sweep/Noise from the Analysis Type drop-down menu.
Step 9: In the AC Sweep Type subpanel, ensure the sweep type is set to Logarithmic. Enter 100 for the Start Frequency, 10MEG for the End Frequency, and 100 for the Points/Decade.
Defining Simulation Files
Step 10: This design contains a component that is not included in the standard PSpice libraries; therefore, the simulation configuration files need to be added to the design. Select Configuration Files from the list on the left to open a window to load configuration and library files.
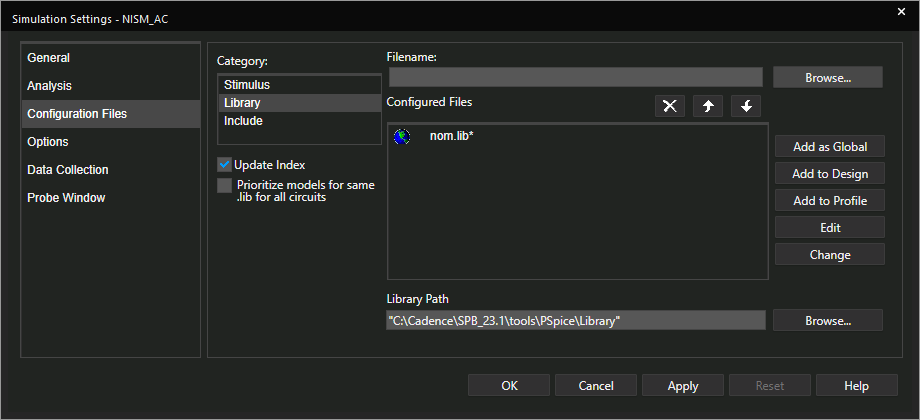
Step 11: Select Library under Category. Select Browse for Filename to open a library file.
Step 12: Browse to the provided lm21212-1_avg.lib file, select the file, and click Open.
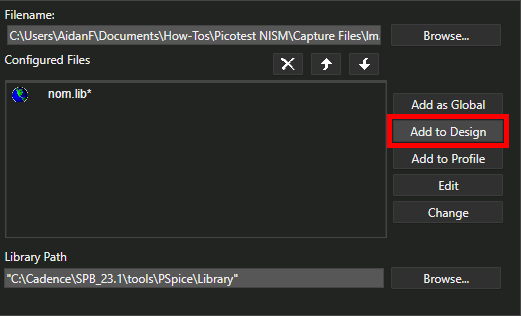
Step 13: Select Add to Design to add the library to the design libraries.
Note: To add a library to all future designs, select Add as Global from the same window.
Step 14: Click OK to save the changes and close the window.
Placing Simulation Probes

Step 15: Probes must placed on the schematic canvas to show any results in the PSpice A/D window. Select the Voltage/Level Marker button from the toolbar.
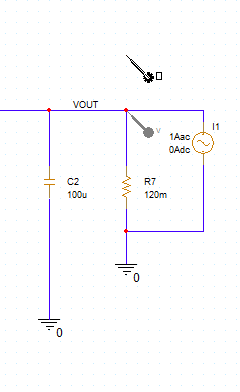
Step 16: Click to place a probe on the VOUT net. When finished, right-click and select End Mode.
Running the Simulation
Step 17: With the library files linked and the probe placed, the simulation is ready to be run. Select PSpice > Run from the menu.
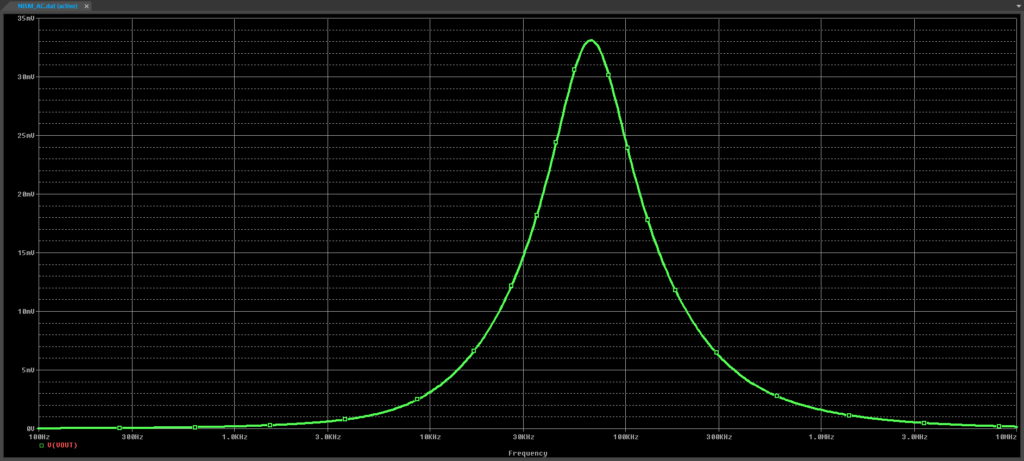
Step 18: The PSpice A/D window opens to show the plotted output voltage over the frequency range. To change the plotted information, double-click the trace name in the bottom-left corner of the graph.
Step 19: The Modify Trace window opens. Enter V(VOUT)/I(I1) for the Trace Expression and click OK. The output impedance is plotted.
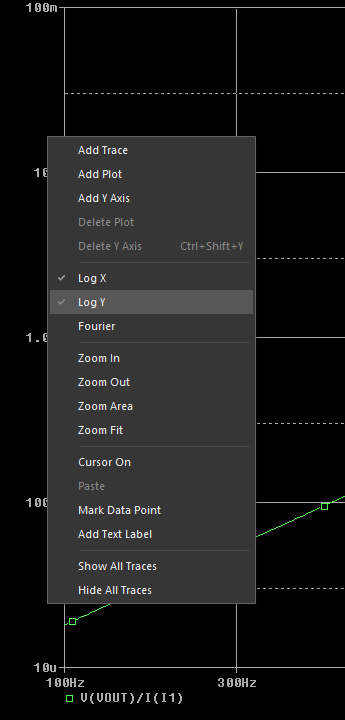
Step 20: Right-click the plot and select Log Y to create a logarithmic Y scale.
Creating a Macro Expression in PSpice
Step 21: To perform a non-invasive stability measurement, the measurement of the QTG curve, which is the derivative of the phase impedance curve, is required. This measurement can be simplified using trace macros. To create a trace macro, select Trace > Macros from the menu.
Note: Learn more about NISM implementation including QTG curves and required circuit modifications for performing NISM in your own PSpice designs here.
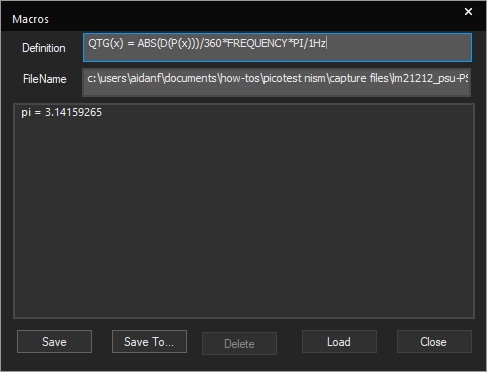
Step 22: The Macros window opens. Enter the trace expression below into the Definition text field.
QTG(x) = ABS(D(P(x)))/360*FREQUENCY*PI/1Hz
Note: The name of the file the macro is stored under is filled in automatically.
Step 23: Click Save to add the expression to the macro list. Click Close.
Step 24: To create a new plot for the expression, select Plot > Add Plot to Window from the menu.

Step 25: A new plot is added. With the new plot selected, select Trace > Add Trace.
Step 26: The Add Trace window opens. Enter QTG(V(VOUT)/I(I1)) for the trace expression and click OK.

Step 27: Right-click the plot and select Log Y to create a logarithmic Y scale.
Perform a Non-Invasive Stability Measurement in PSpice
Step 28: Stability margin is calculated as a measurement equation. To perform a non-invasive stability measurement, select Trace > Evaluate Measurement from the menu.
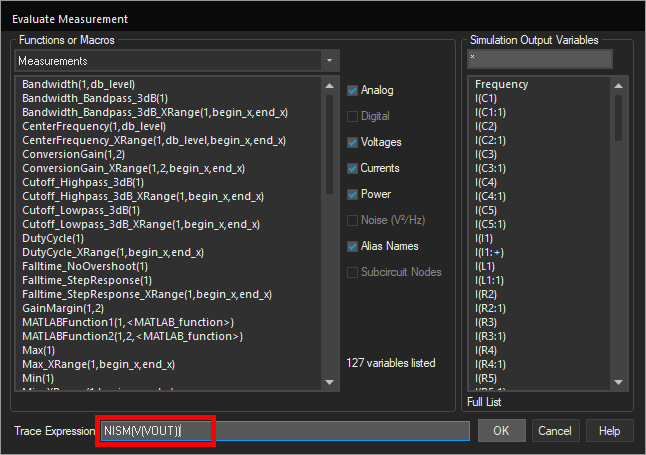
Step 29: Enter NISM(V(VOUT)) into the Trace Expression text field and click OK.
Note: In this example, the relative maximum is also the absolute maximum. If this is not the case in your design, use the expression NISM_Range([net], [low end], [high end]).

Step 30: View the measurement results. The calculated stability margin is approximately 41.4°.
Wrap Up & Next Steps
Quickly perform a non-invasive stability measurement to accurately determine the expected stability margin of your circuit with Picotest NISM in PSpice. Upgrade to the latest 23.1 release or test out this feature and more with a free trial of OrCAD.
If you would like more information on how to perform a non-invasive stability measurement with PSpice and your test equipment, view the NISM manual from Picotest.